Platform
- Platform OverviewCreate, personalize, and optimize interactive experiences
- EnterpriseSecurity, control, and scale for enterprise teams
- Data, Personalization & AnalyticsCapture data and improve performance with insights
- FeaturesExplore all capabilities to build and launch experiences
- IntegrationsConnect with your CRM and marketing tools
Services
BY USE CASE
- Lead Generation & QualificationCapture and qualify high-intent leads
- Product DiscoveryGuide users to the right product
- Interactive PromotionsBoost engagement with interactive campaigns
- Sales EnablementSupport sales with interactive tools
- Content MarketingTurn content into engaging experiences
- Customer EducationGuide users through interactive learning
BY INDUSTRY
- SaaS & TechnologyAccelerate product understanding and adoption
- Retail, eCommerce & Consumer GoodsDrive conversions and product discovery
- Healthcare, Life Sciences & PharmaceuticalsEducate and engage with compliant experiences
- Financial Services, Insurance & Real EstateBuild trust and simplify complex offerings
- Entertainment & MediaIncrease audience engagement
- ManufacturingSimplify products and capture qualified leads
LEARN
SUPPORT
COMPANY

A Consumer Debt Infographic
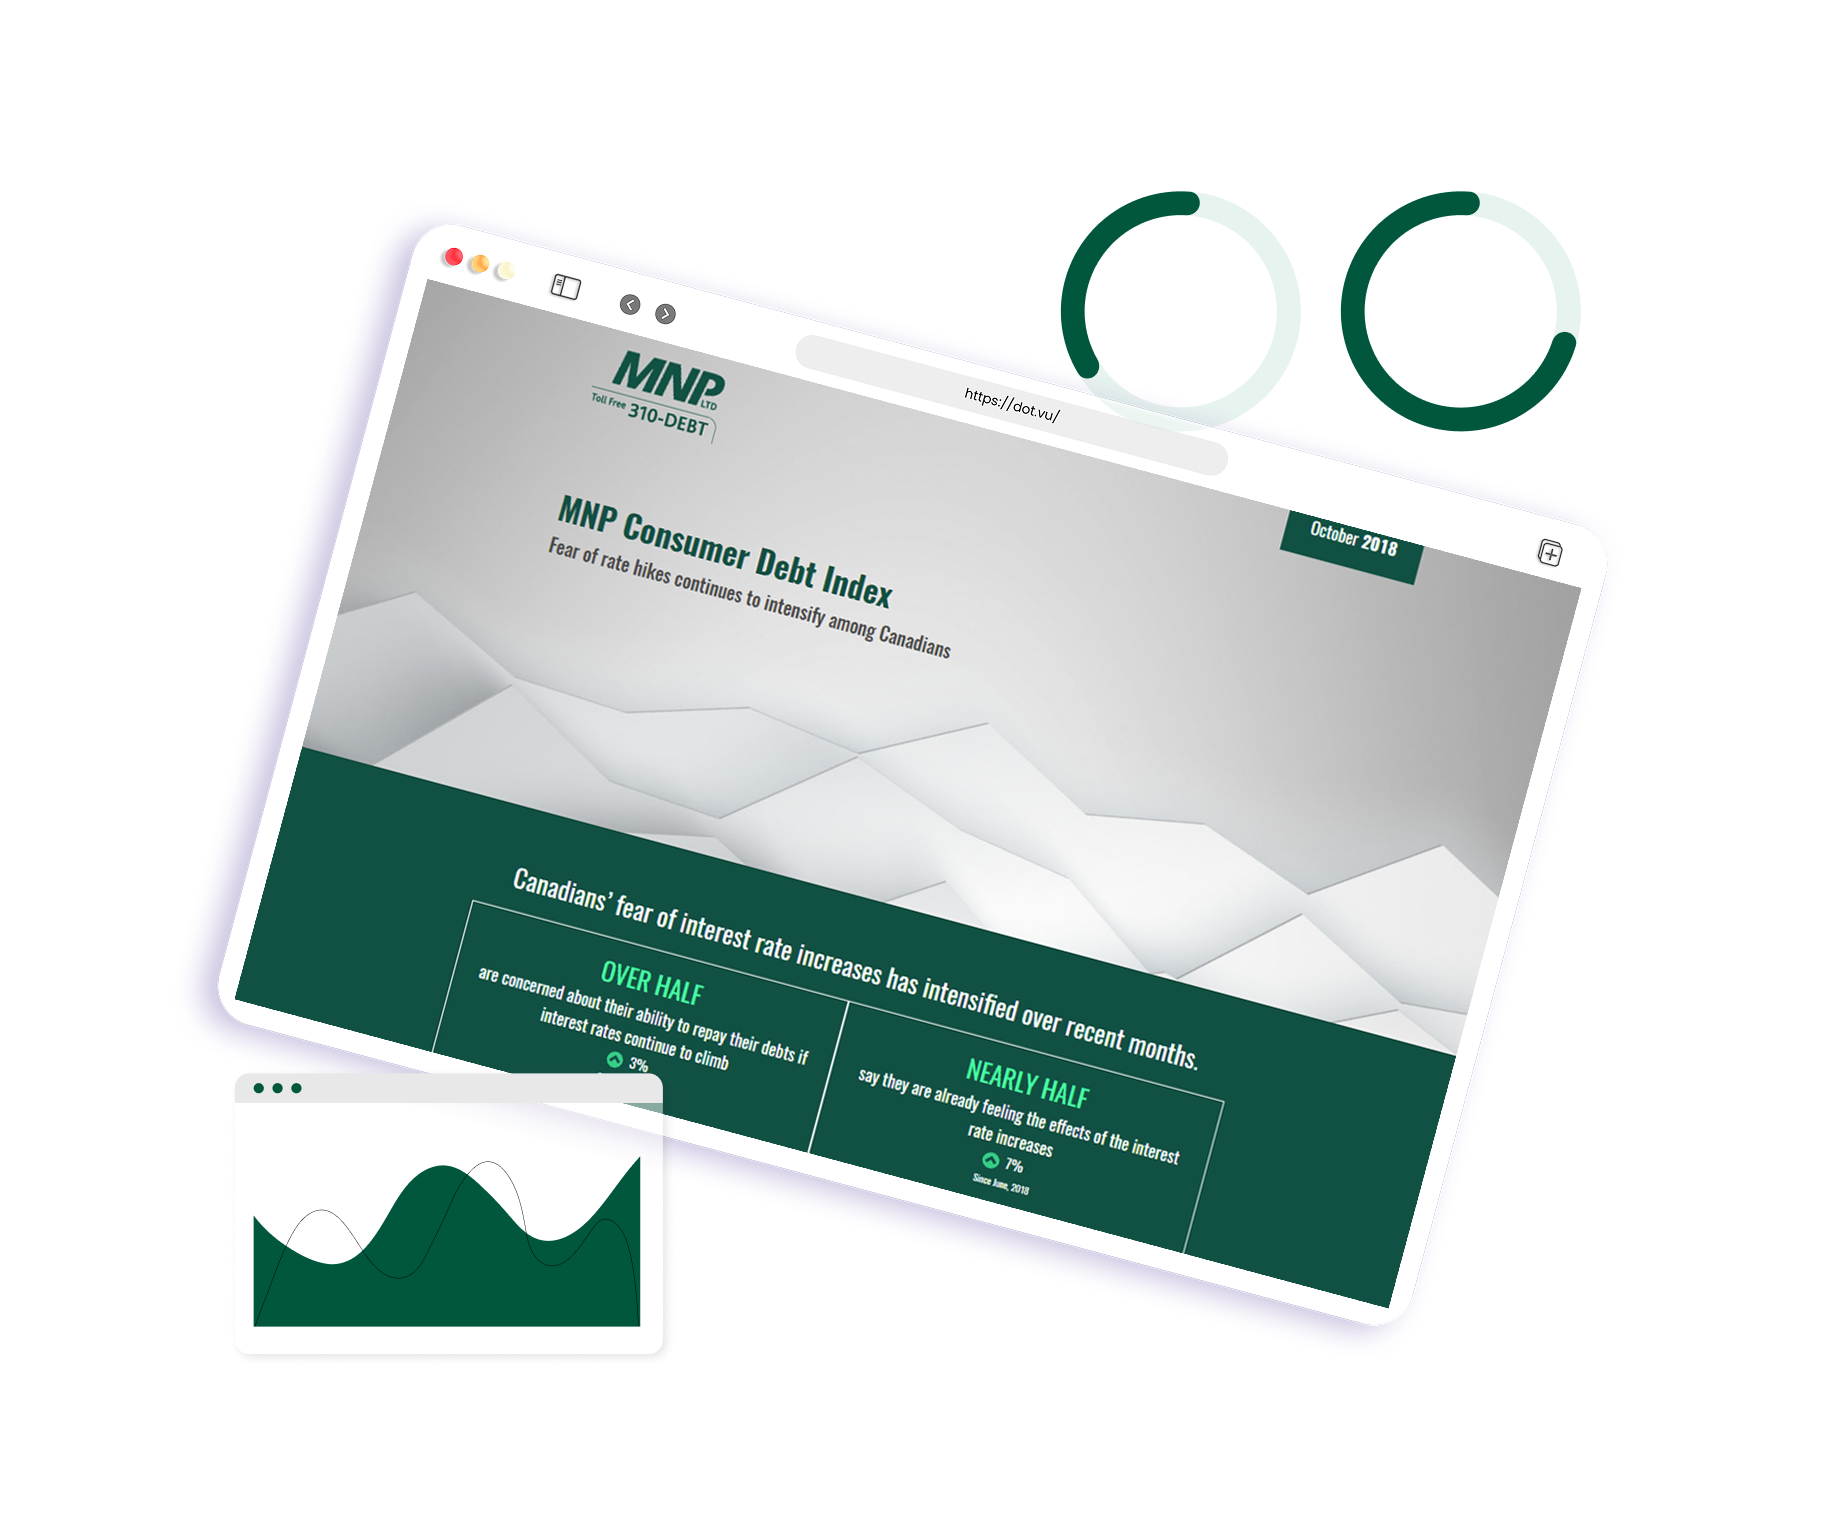
MNP aimed to better communicate with its customers about the rising Consumer Debt Index in Canada and position itself as a leading expert within its field.
2 Weeks
Creation Time
+1, 000 000
Number of Visits
+30, 000
Leads Generated
The Challenge
MNP faced the struggle of better communicating and easing the fear of their customers in Canada due to the rate hikes in Consumer Debt. They wanted to ensure they conveyed their message more effectively and provided their customers with all the insights needed to understand better the current market conditions and the rising Consumer Debt in Canada.
Therefore, MNP decided to work together with Dot.vu and create an Interactive Infographic with the following goals:
The Concept and the Solution
The concept created was an animated infographic packed with insights about consumer debt in Canada and the rising fear of rate hikes associated with the subject. The main objective for MNP was to engage their audience, educate them and convey their message more effectively. Besides, the content piece also helps solidify and secure their position as an expert in their industry.
The Result
The Infographic was very educational, containing important information and statistics about the market conditions and how it was perceived by Canadian debt holders and their situation, including the option for a free consultation at the end of the infographic.
Dot.vu is proud to have contributed to such an important project and helped MNP reach its goals through Interactive Content.

About the Company
MNP is a leading national accounting, tax, and business consulting firm in Canada that serves and responds to its client's needs in the public, private, and non-profit sectors.
Through partner-led engagements, they provide a collaborative, cost-effective approach to doing business and personalized strategies to help organizations succeed across the country and around the world.
Company Facts
Industry
Accounting & Finance
Professional Services
Company Size
+7000
Headquarter
Calgary, Alberta,
Canada
Project
Animated Infographic
Related Interactive Experiences
Interactive Infographic
Assessment
Trusted by Leading Global Brands
Brands around the world use Dot.vu to create Interactive Experiences that drive engagement, lead generation, and measurable results.
“The Product Finder campaigns brought remarkable results for Superdrug. Conversion rates rose from an average of 3-4% to an impressive 12-13%, contributing to higher online sales.”

Darren Baker, Ecommerce Design Manager at Superdrug
“The quiz created a highly engaging experience, reaching a 90% completion rate and driving a 5× increase in participation, significantly boosting booth traffic and lead generation.”

Christine Theoret , Marketing Manager at Dechra
“The Advent Calendar was a massive success for ColorStreet. The Interactive Experience got more than a million visits and brought more than 30 thousand leads.”

Hannah Park, Marketing, ColorStreet
Turn Your Content Into a Conversion Engine with AI-Powered Interactive Experiences
© 2026 Dot Marketing ApS. All rights reserved.