Platform
- Platform OverviewCreate, personalize, and optimize interactive experiences
- EnterpriseSecurity, control, and scale for enterprise teams
- Data, Personalization & AnalyticsCapture data and improve performance with insights
- FeaturesExplore all capabilities to build and launch experiences
- IntegrationsConnect with your CRM and marketing tools
Services
BY SOLUTIONS
BY USE CASE
- Lead Generation & QualificationCapture and qualify high-intent leads
- Product DiscoveryGuide users to the right product
- Interactive PromotionsBoost engagement with interactive campaigns
- Sales EnablementSupport sales with interactive tools
- Content MarketingTurn content into engaging experiences
- Customer EducationGuide users through interactive learning
BY INDUSTRY
- SaaS & TechnologyAccelerate product understanding and adoption
- Retail, eCommerce & Consumer GoodsDrive conversions and product discovery
- Healthcare, Life Sciences & PharmaceuticalsEducate and engage with compliant experiences
- Financial Services, Insurance & Real EstateBuild trust and simplify complex offerings
- Entertainment & MediaIncrease audience engagement
- ManufacturingSimplify products and capture qualified leads
LEARN
SUPPORT
COMPANY
AI-Powered Interactive Infographics
Turn Static Visuals into Interactive Infographics
Present data, timelines, and processes with Interactive Infographics that combines storytelling and interaction to help users explore content, understand insights, and stay engaged longer.
Try Me
What Makes Interactive Infographics Effective
Interactive Infographics turn static visuals into experiences users can actively explore through clicks, animations, and interaction.
Dot.vu’s Guided Selling solution goes beyond basic Product Recommendation quizzes. Create Interactive Experiences that adapt to user needs, preferences, and responses in real time.
Guide users through logic-based journeys with personalized recommendations, structured decision flows, and tailored interactions that support more informed choices.
Build Product Recommenders, Product Finders, Solution Builders, and Product Configurators that simplify decision-making, improve qualification, and support more confident buying journeys.
Complex Information is Often Difficult to Engage With
When information is overloaded with text or static visuals, users are more likely to lose attention or miss important insights.
Static visuals can make important insights harder to remember and retain.
Users quickly disengage when information feels overwhelming or passive.
Complex topics are harder to explore without structured interaction.
Before
After
Too many choices
Users are left to browse endless options without guidance, leading to decision fatigue and drop-offs.
No personalization
Every visitor sees the same products, regardless of their needs, preferences, or intent.
Low-quality leads
Without structured input, you miss the chance to capture meaningful data and qualify users properly.
Interactive Infographic Experiences for Data, Storytelling, and Education
Create Interactive Infographics that help users explore information through visuals, interaction, and guided discovery.
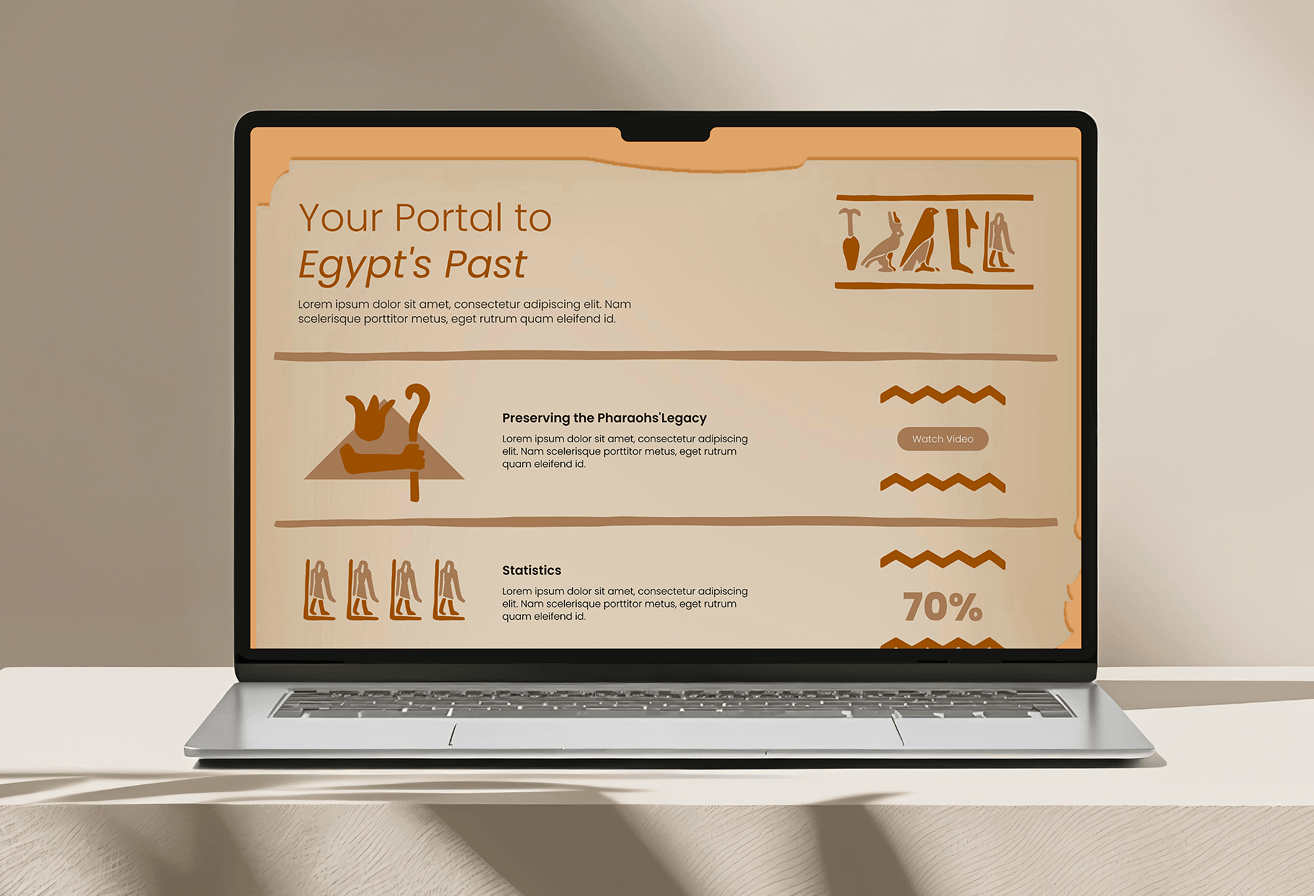
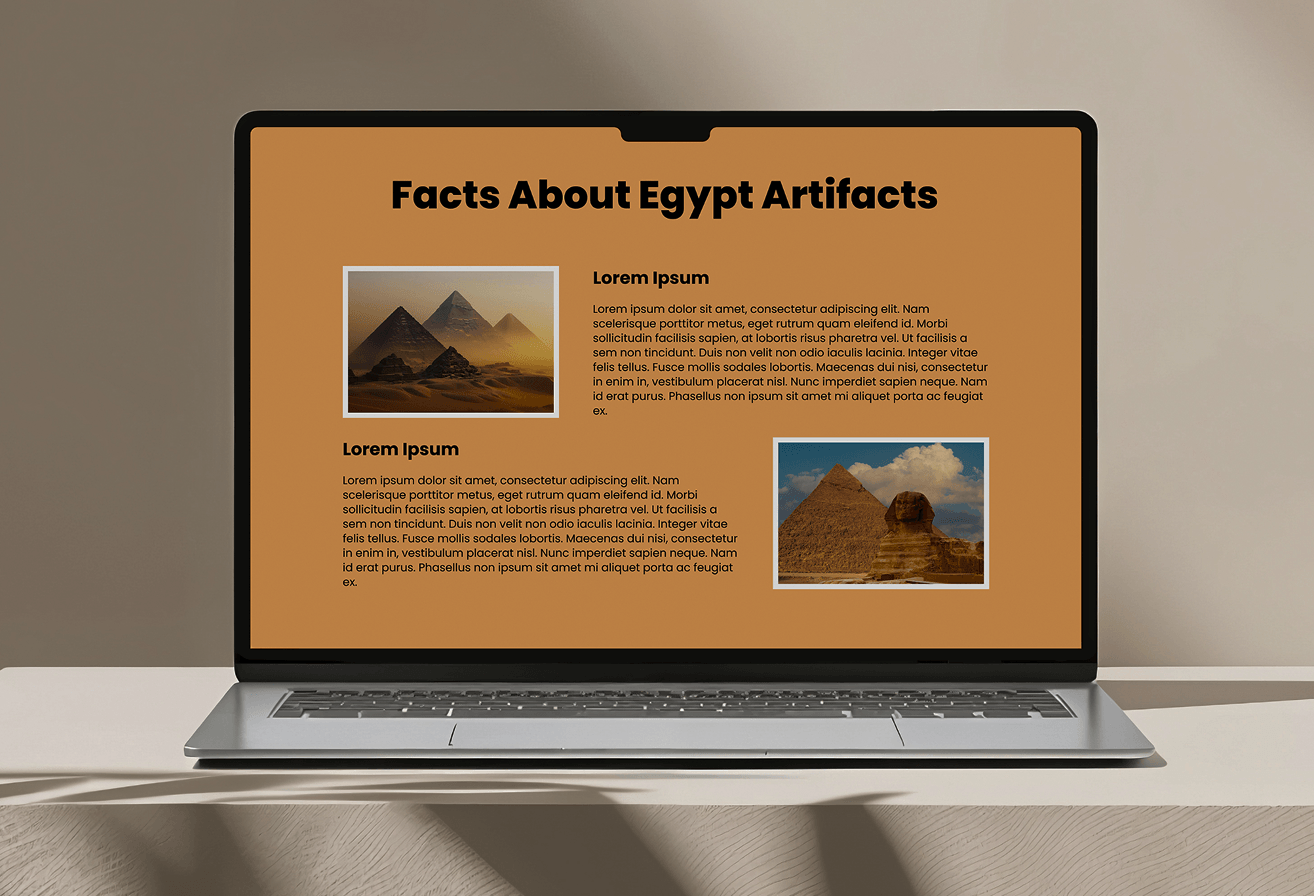
Statistical Infographics
Present statistics and reports through Interactive Infographics with visuals, animations, and clickable elements that improve understanding.

Visualize data through interactive elements
Combine charts, animations, and media
Add clickable hotspots and layered information
Improve engagement with complex statistics
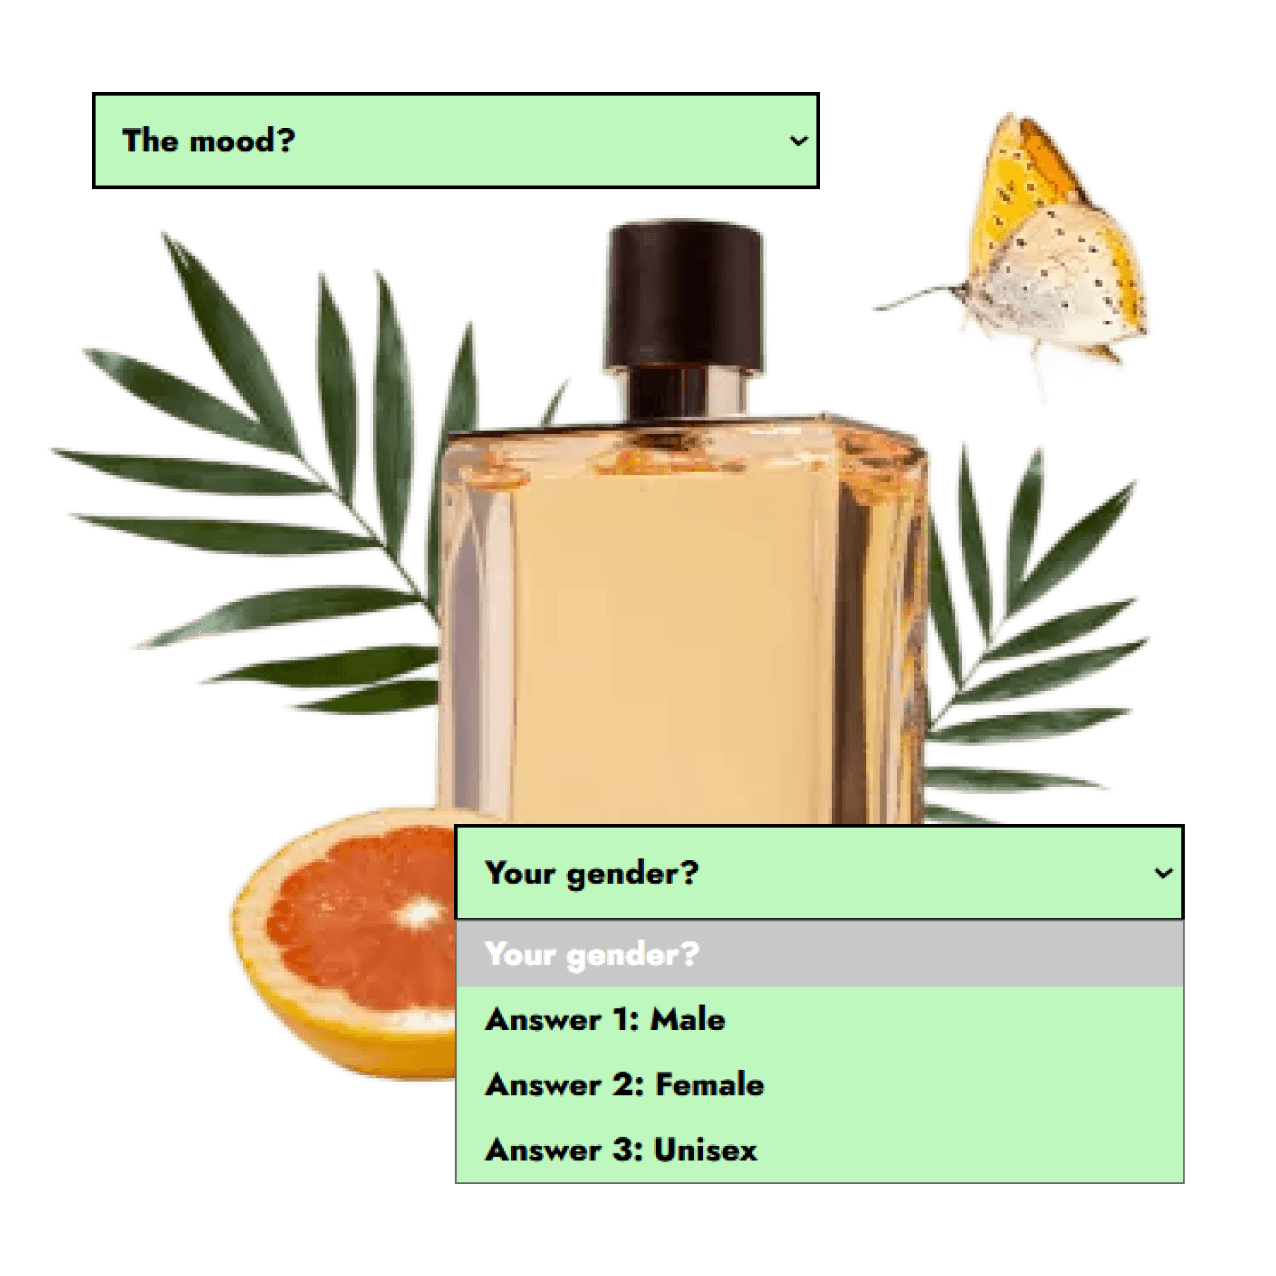
Product Recommenders & Product Finders
Guide users to the right product with interactive product recommenders that ask targeted questions and deliver personalized recommendations based on preferences, needs, and budget.
Ideal for eCommerce and large product catalogs. Interactive Product finders simplifies decision-making, reduces drop-offs, and increases conversion rates by matching users with the best-fit products instantly.
Ask dynamic questions to refine user preferences
Deliver personalized product recommendations in real time
Reduce decision fatigue and increase conversion rates
Capture zero-party data for personalization and follow-up

Theme
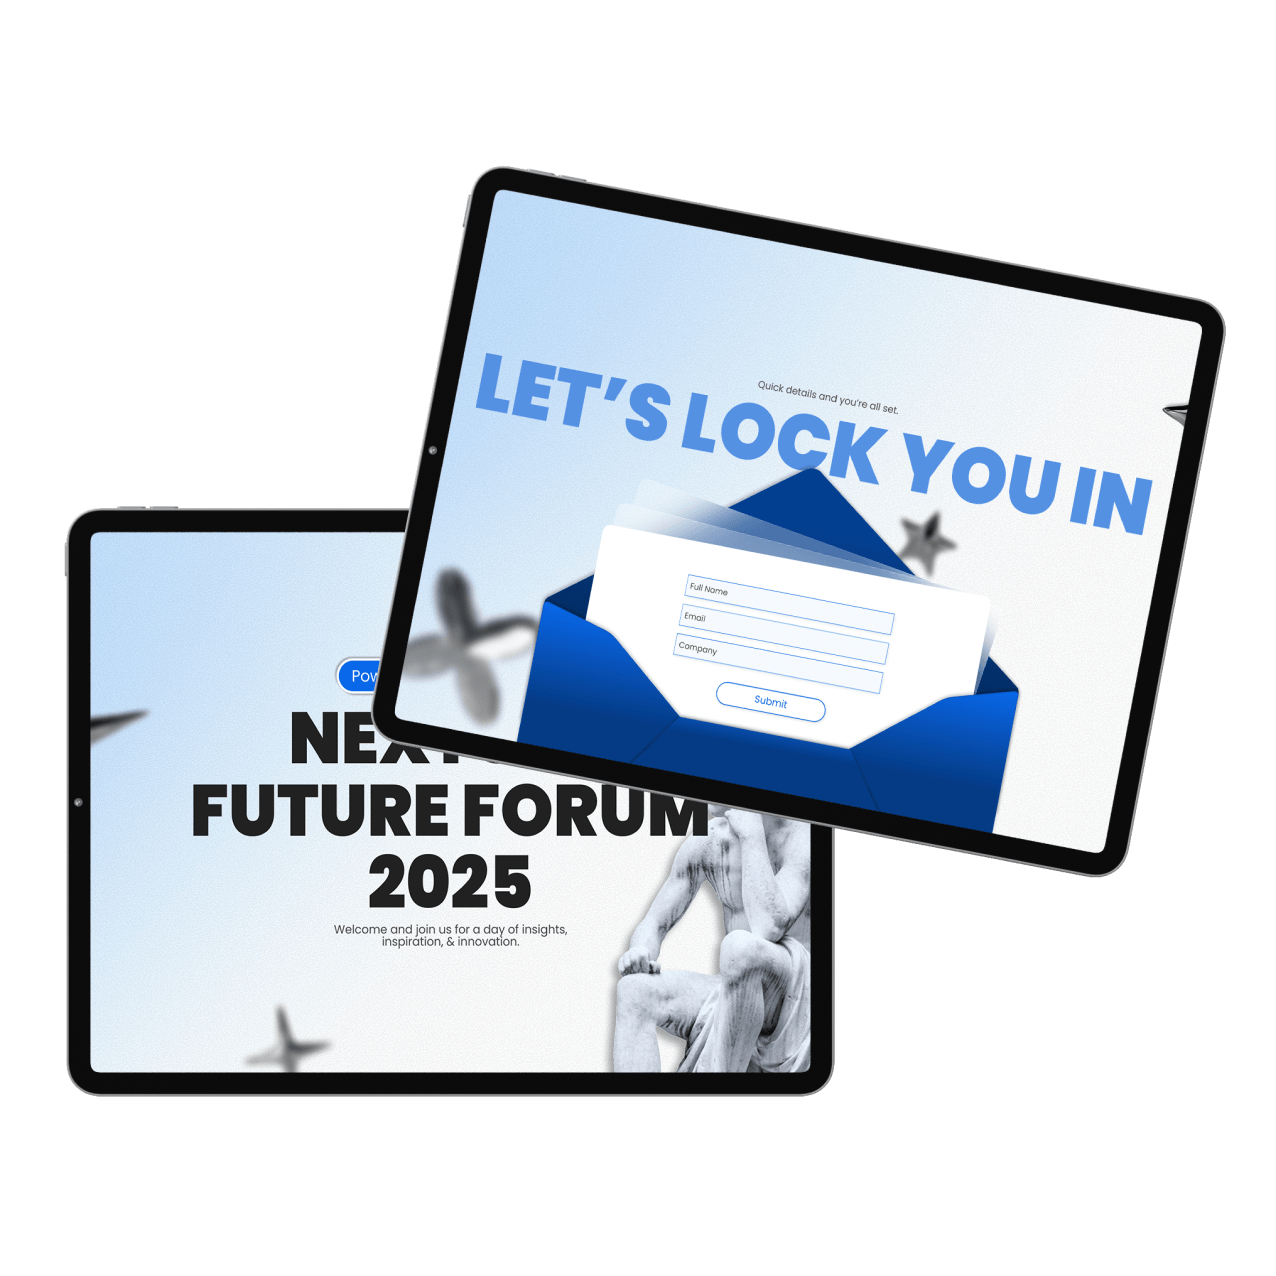
What is Dot.vu
Oneplatform.Manywaystomakecontentinteractive.
Dot.vu turns static content into Interactive Experiences that guide buyers, capture zero-party data, and generate qualified leads.
Explore formats
✦ Drag the cards to explore
Autumn Twilight · All Formats
Create Interactive Infographics Without Limitations
Design infographic experiences with full control over visuals, interaction, and information flow.
AI Interactive Builder
Describe your infographic and generate interactive layouts, content structures, and visual flows instantly.

Interactive elements
Embed quizzes, videos, calculators, forms, and other interactive experiences directly into your infographic.

Animations and transitions
Use animations to guide attention and emphasize important information.

Clickable hotspots
Turn visual elements into interactive hotspots that reveal additional information and content.

AI Interactive Builder
Describe your Guided Selling experience and generate Product Recommenders, Solution Builders, and Configurators in minutes. Create structured flows that adapt to user input without starting from scratch.
Customizable product display
Control how products and solutions are presented using flexible catalog layouts and interactive formats.
Add-to-cart integration
Let users add recommended products directly to their cart, reducing friction and accelerating conversion.
Live product feed
Sync with your product catalogue to reflect real-time pricing, availability, and updates.
Automated result delivery
Send personalized recommendations via email, capturing leads and extending engagement beyond the experience.
Make Information More Engaging and Easier to Understand
Interactive Infographics improve engagement, simplify complex information, and support better understanding through visual interaction.

Increase user engagement
Encourage users to explore information through interaction.

Improve long-term information retention
shroten: Interactive visual experiences help users remember key insights.

Simplify complex technical topics
Break down information into structured, easy-to-follow visual interactions.

Support visual storytelling
Present information through narratives and guided exploration.
Increase conversions
Match users with the right products or solutions, reducing hesitation and boosting purchase confidence.
Capture high-quality zero-party data
Collect zero-party data through guided interactions to better understand user intent and preferences.
Shorten the sales cycle
Help users reach decisions faster with personalized recommendations and structured journeys.
Improve customer experience
Deliver tailored guidance that feels like a one-on-one conversation, building trust and engagement.
Create independently or scale with dedicated support
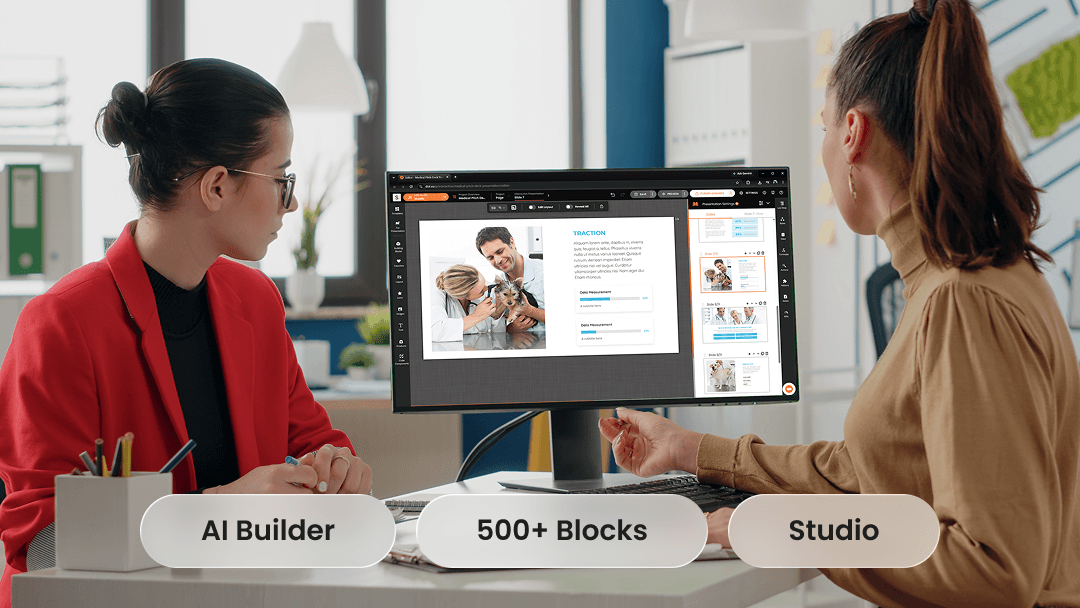
Dot.vu Self-Service
For individuals and small teams creating independently.
Hosted Publishing
Reusable Assets
KPIs & Analytics
AI Interactive Builder
500+ Building Blocks
Self-Managed Setup

Dot.vu for Business
For companies to scale with managed support and deeper integration.
Support & Training
SLA & Security
Integrations & API
Agency Services
Multiple Domains
SSO for experiences
Interactive Infographics Across Industries
Present information, data, and stories across industries through Interactive Infographics designed for engagement and understanding.

SaaS & Technology

SaaS & Technology
Explain products, workflows, and technical concepts through interactive visual storytelling.

Retail, eCommerce & Consumer Goods
Retail, eCommerce & Consumer Goods
Present product information, trends, and campaigns through engaging visual experiences.

Healthcare, Life Sciences & Pharmaceuticals
Healthcare, Life Sciences & Pharmaceuticals
Simplify complex medical, scientific, and educational information through visual interaction.

Financial Services, Insurance & Real Estate
Financial Services, Insurance & Real Estate
Present reports, financial insights, and processes in a more digestible format.

Manufacturing
Manufacturing
Visualize processes, systems, and operational information more clearly.

Entertainment & Media
Entertainment & Media
Create interactive stories, timelines, and campaign experiences that increase audience engagement.
SaaS & Technology
SaaS & Technology
Explain products, workflows, and technical concepts through interactive visual storytelling.
Retail, eCommerce & Consumer Goods
Retail, eCommerce & Consumer Goods
Present product information, trends, and campaigns through engaging visual experiences.
Healthcare, Life Sciences & Pharmaceuticals
Healthcare, Life Sciences & Pharmaceuticals
Simplify complex medical, scientific, and educational information through visual interaction.
Financial Services, Insurance & Real Estate
Financial Services, Insurance & Real Estate
Present reports, financial insights, and processes in a more digestible format.
Manufacturing
Manufacturing
Visualize processes, systems, and operational information more clearly.
Entertainment & Media
Entertainment & Media
Create interactive stories, timelines, and campaign experiences that increase audience engagement.
Retail, eCommerce & Consumer Goods
Turn product discovery into guided journeys with Product Recommenders, Gift Finders, and Quizzes that match shoppers with the right products and increase conversions.
Financial Services, Insurance & Real Estate
Simplify complex offerings with Solution Builders, Calculators, and guided flows that help users compare options and make confident financial decisions.
SaaS & Technology
Help users navigate features, plans, and use cases with Guided Selling Experiences that act like digital sales assistants, accelerating product understanding and adoption.
Manufacturing
Support complex product selection with Product Configurators and Solution Builders that guide users through specifications, requirements, and technical decisions.
Healthcare, Life Sciences & Pharmaceuticals
Guide patients and professionals through complex treatments, products, or services with Interactive Assessments, Solution Builders, and personalized recommendation flows that improve understanding and confidence.
Entertainment & Media
Create interactive recommendation experiences that guide users to relevant content, products, or offers based on their preferences and behavior.
Interactive Infographic Performance Across Campaigns and Content
Interactive Infographics support stronger engagement, better information retention, and more effective content exploration.

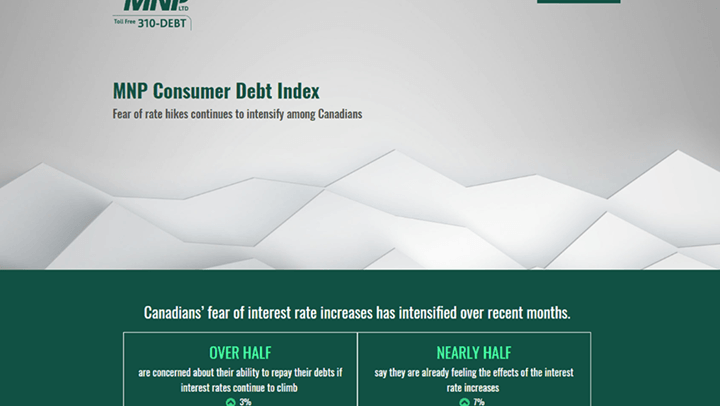
MNP — Consumer Debt Infographic
Get 4x
More Qualified Leads
Up to +75%
Higher Engagement Rates
Growth of +55%
In Conversions Rates
Frequently Asked Questions
Dot.vu is an AI-powered Interactive Content platform that helps teams create Interactive Experiences without relying on developers. Build everything from quizzes and calculators to Guided Selling experiences, Interactive Videos, and Marketing Games using templates, drag-and-drop editing, reusable components, and AI-assisted workflows. Learn more on the Platform Overview page or explore all Interactive Experience solutions.
Yes. Business and Enterprise are designed to connect Dot.vu with existing websites, apps, CRM systems, marketing platforms, customer data, and other business systems. Explore our integrations for more details.
Self-Service includes Free, Starter, and Growth for creating and managing Interactive Experiences independently. Business adds managed support and ongoing guidance from the Dot.vu team. Enterprise provides a more tailored setup for larger or more complex organizations with advanced requirements across teams, brands, markets, security, or infrastructure.
Yes. In addition to the platform, Dot.vu offers strategic guidance, onboarding, training, and Agency Services for teams that want support with design, development, personalization, or full Interactive Experience creation. Learn more about our Professional Services and Enterprise support.
Yes. Business supports selected multi-brand or multi-market requirements, while Enterprise supports broader organization-wide governance.
An Interactive Infographic is a digital visual representation of information or data that allows users to engage with its content. It can include clickable elements, animations, quizzes, charts, videos, and other interactive features that encourage exploration and participation.
A static infographic presents information in a fixed visual format, while an Interactive Infographic allows users to explore information through actions such as clicking, selecting, answering questions, or revealing additional content.
Interactive Infographics help simplify complex information, encourage audience engagement, improve content understanding, and communicate data more effectively. They can also support lead generation and provide insights into audience interests.
Examples include interactive data visualizations, industry reports, educational guides, product comparisons, interactive timelines, decision trees, and step-by-step process explainers.
With Dot.vu, you can combine visual content, data, and interactive elements to create an Interactive Infographic. Start with a template, describe your idea using the AI Interactive Builder, or create a custom experience without coding.
You can add clickable hotspots, animations, charts, videos, quizzes, calculators, navigation controls, and expandable information. These elements allow users to explore information based on their interests.
Yes. Interactive Infographics can present data through charts, comparisons, visual indicators, and interactive calculations. Users can explore different data points or adjust inputs to better understand the information presented.
Yes. Interactive Infographics can include forms, assessments, gated content, personalized results, and calls to action. These features give audiences opportunities to share their information while receiving relevant content or insights.
Yes. Dot.vu allows you to embed Interactive Infographics into websites, blog posts, and landing pages or publish them as standalone experiences, depending on your publishing options.
Yes. You can start creating Interactive Infographics with Dot.vu's Free plan. Publishing allowances, branding, and advanced functionality vary by plan.
Create Infographics Users Can Explore
© 2026 Dot Marketing ApS. All rights reserved.